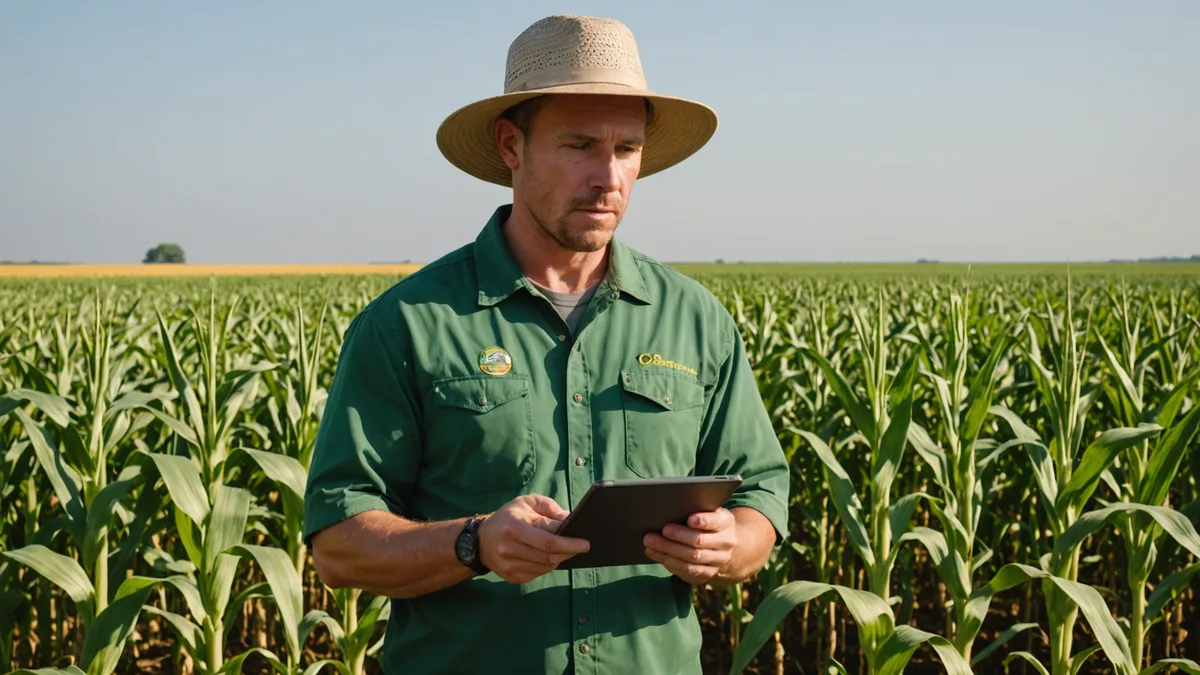
A Certified Crop Advisor managing 30,000 acres across a regional territory has, optimistically, one hour per field per month during the growing season. With 200 to 300 fields in the territory, a 30-day scouting rotation means roughly one visit per field per month, assuming no rain delays, no equipment issues, and no customer calls that eat the afternoon.
That math has been the structural constraint on agronomy services for decades. Satellite NDVI monitoring has been marketed as the solution, but most of the platforms available before Croploom delivered a different problem: instead of "I need to scout every field," you now have "I have 40 flagged zones and no way to know which three are actually time-sensitive."
The anomaly prioritization problem
Satellite monitoring generates more signals than most operators can act on. A platform that monitors 200 fields will generate dozens of NDVI anomaly flags per week during peak growing season. Without an intelligent ranking system, you've traded "which field do I go to?" for "which anomaly alert do I look at first?" That's not progress. It's alert fatigue with satellite branding.
The Croploom AI analysis layer was designed to solve the anomaly prioritization problem specifically. The model doesn't just flag zones where NDVI is low relative to field average. It considers the trajectory (is the NDVI declining, stable, or recovering?), the spatial pattern (is this a point anomaly consistent with equipment damage or a zone pattern consistent with soil variability?), the seasonality (is this stress pattern appropriate for the crop stage?), and the historical pattern (is this zone consistently underperforming or is this a new development?).
What AI analysis changes
The practical output is a ranked list of zones that combines satellite data, historical performance, and crop-stage context into a single triage priority. Instead of "40 anomaly alerts this week," you see "3 zones that warrant immediate investigation, 8 that should be visited this week, and 12 that you can defer to next rotation unless the trend continues."
That compression from 40 signals to 3 urgent cases is where AI image analysis actually solves the scouting time problem. The agronomist still makes the field call. But the 3 fields they visit in the next 48 hours are the ones that matter most, not the ones that happen to be on the route they drove last week.
Confidence intervals and uncertainty
One thing the Croploom analysis output includes that most satellite platforms don't: confidence intervals on the stress hypothesis. When the model produces a "probable nitrogen deficiency" hypothesis, it's also indicating how confident it is in that classification versus the alternative hypotheses.
A high-confidence nitrogen flag from a historically low-organic-matter field zone in a wet spring with known pre-plant N timing issues is a different management decision than a low-confidence general stress flag from a zone that's been healthy for three seasons. Treating those two signals identically is one of the ways overfitted alert systems generate agronomist mistrust.
The confidence output keeps the agronomist in the loop on what the model knows and what it doesn't, which is how AI analysis should work as a decision-support tool rather than an automated prescription system.
How the ranking algorithm works
The Croploom priority ranking combines five inputs for each flagged zone: NDVI severity (how far below field average), trajectory (rate of decline over the last 2 to 3 satellite passes), crop growth stage at flag time (is this within the management-responsive window?), zone history (has this zone flagged before?), and regional context (are similar fields in the same county showing the same pattern?).
Each input is weighted by its predictive value for agronomic urgency rather than simply by its signal strength. A zone with a large NDVI deviation that has shown the same pattern in the same week for 3 consecutive years gets a lower urgency ranking than a zone with a smaller deviation that is showing a new pattern for the first time. The historical consistency suggests the prior case reflects a stable soil feature that has already been accounted for in the prescription plan; the new pattern suggests something that warrants investigation regardless of its current severity.
The regional context layer is particularly useful during the first 2 to 4 weeks after a major weather event -- a drought period, a flooding event, a late frost. When many fields in the same county are showing simultaneous NDVI declines, the system downweights the urgency of individual-field flags because the stressor is likely weather-driven and field-wide rather than a zone-specific problem with an agronomic intervention available. When a field shows a pattern that diverges from the regional trend, the divergence itself is a high-urgency signal.
Agronomist trust and system calibration
The hardest part of deploying AI-assisted scouting prioritization is earning and maintaining agronomist trust in the system's outputs. The most common failure mode in early satellite monitoring platforms was the opposite of false-negative: systems that generated so many alerts that users stopped trusting the prioritization entirely and went back to field-order scouting.
Croploom tracks the outcome of every high-priority flag that an agronomist investigates: was a real agronomic issue found, was the stress type classification correct, and did the urgency ranking match the actual time sensitivity of the problem? That feedback loop lets the model calibrate to the specific patterns and soil types in a given territory over time. An agronomist who has used the system for a full growing season should see their false-positive rate drop significantly compared to the first season, because the model has learned which patterns in their specific geography reliably predict actionable problems and which ones don't.