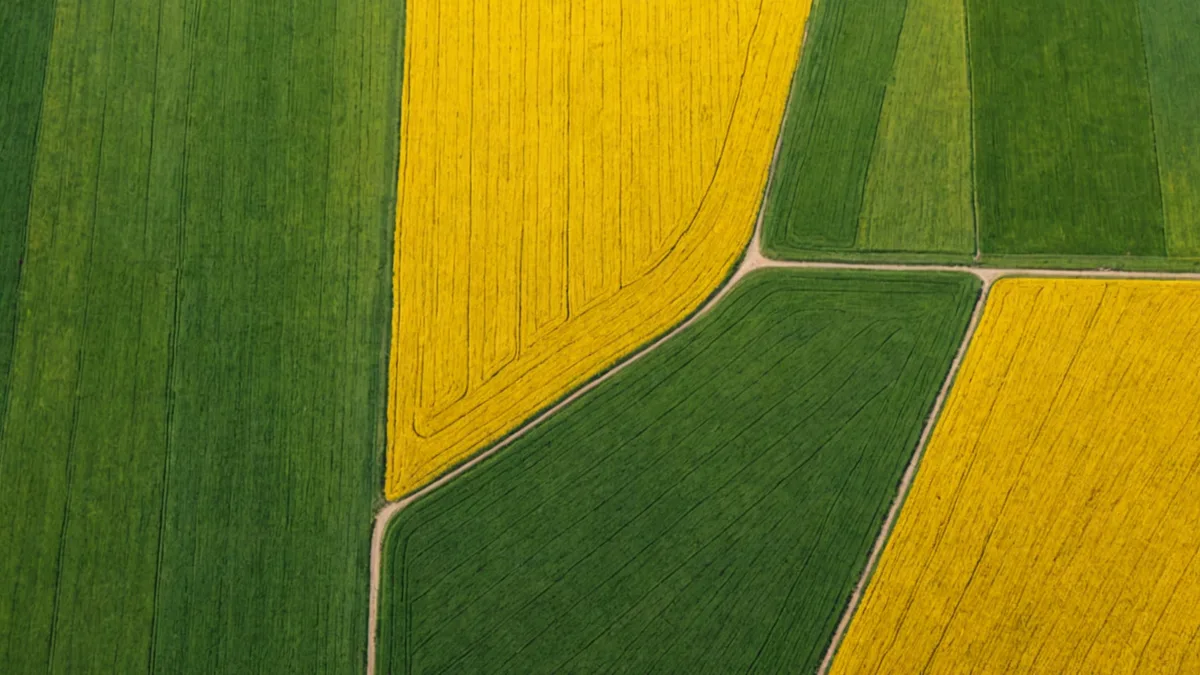
The starting point for most precision agriculture programs is drawing zone boundaries on a map. It seems straightforward until you realize that most operations have been drawing the wrong zones, or zones at the wrong scale, and then wondering why their variable-rate prescriptions aren't improving yield.
The terminology itself creates confusion. "Field zones" and "management zones" get used interchangeably, but they describe fundamentally different things, and conflating them is one of the most common structural errors in how growers approach precision ag.
Field zones: what the data shows
A field zone is a spatial unit defined by a consistent signal in some measured variable: historical NDVI, topography, soil ECa, yield monitor data. The zone boundaries represent where that signal changes. These are objective, data-driven, and independent of any management intention.
Croploom generates field zones from multi-year satellite imagery stacking, which captures stable spatial patterns in crop performance that persist across seasons, crops, and management changes. The stability across seasons is what distinguishes an actual soil or landscape feature from a one-year management artifact.
Management zones: what you're going to do about it
A management zone is a spatial unit defined by a shared optimal management practice. The management zone boundaries ask: where in this field would I apply the same seed rate, the same fertility prescription, the same fungicide? The management zone is the zone you're building a prescription for.
Management zones can and often should be different from field zones. Not every field zone warrants a separate management prescription. If two field zones that show different NDVI patterns both have the same optimal seeding rate based on their topographic positions, there's no value in treating them as separate management zones for that input.
The error of over-zoning
Most growers who adopt precision agriculture try to use field zone maps directly as management zone maps. You end up with 8 to 12 zones per field, a different prescription for each, and no practical ability to verify whether the prescriptions are correct. The equipment can execute a 12-zone VRA prescription, but your ability to validate that 12-zone recommendation against yield data degrades rapidly as the zones get smaller and more numerous.
The more defensible approach is to collapse field zones into 3 to 5 management categories per field based on the agronomic question you're trying to answer. For seeding rate, you might distinguish 3 management categories based on water-holding capacity. For nitrogen, you might distinguish 4 based on organic matter and drainage class.
How satellite temporal stacking helps
The value of multi-year satellite data for zone delineation is that it shows you the persistent patterns, not the one-year noise. A single season of NDVI data has significant year-specific weather influence. Five years of stacked data lets the stable spatial patterns emerge: the well-drained hilltop that underperforms in dry years but is one of your top zones in wet ones, the clay flat that's your worst zone in wet springs and a mid performer in average years.
Those temporal patterns are the substrate for creating management zones that actually represent agronomically distinct units, not just clusters of pixels that happened to have similar NDVI values in one specific year.
Building a practical 3-zone model
For a typical 160-acre corn and soybean field in central Iowa, a 3-zone management model covers most of the agronomic variability that's actionable with current equipment capabilities. The three zones roughly correspond to: well-drained productive soils, moderately drained soils with average performance, and low areas or restrictive-drainage soils that underperform in wet years and respond differently to nitrogen and seeding rate.
Constructing those three management zones from Croploom's multi-year satellite data starts by stacking 4 to 6 years of peak-season NDVI and sorting each pixel by its average performance and its performance variance across seasons. Pixels with consistently high NDVI across wet and dry years tend to be the well-drained productive class. Pixels with high variance -- good in dry years, poor in wet years -- are the drainage-restricted class. The middle cluster is everything else.
Those three stability-variance clusters map directly onto the 3-zone management structure most agronomists already use intuitively. The satellite data just makes the zone boundaries explicit, consistent, and reproducible from one season to the next without re-mapping from scratch.
Updating zones as new data arrives
A common question from growers new to satellite-based zone mapping is whether the zone map needs to be re-drawn each year. In most cases, the answer is no. The field zones based on multi-year stacking are capturing stable soil and landscape features that don't change year-to-year. A tile-drained field that gets a major drainage improvement is an exception -- that genuinely changes the zone structure, and the new season's satellite data will reflect it.
What does update year-to-year is the in-season monitoring data: where within the management zones is stress emerging this year, how does it compare to prior years, and is the pattern suggesting the management prescriptions are working. The zone structure is the standing map; the in-season data is the current-state overlay. Keeping those two layers separate in your thinking, and in your platform, is the discipline that makes precision agriculture improve over time rather than just generating a new colorful map every spring.