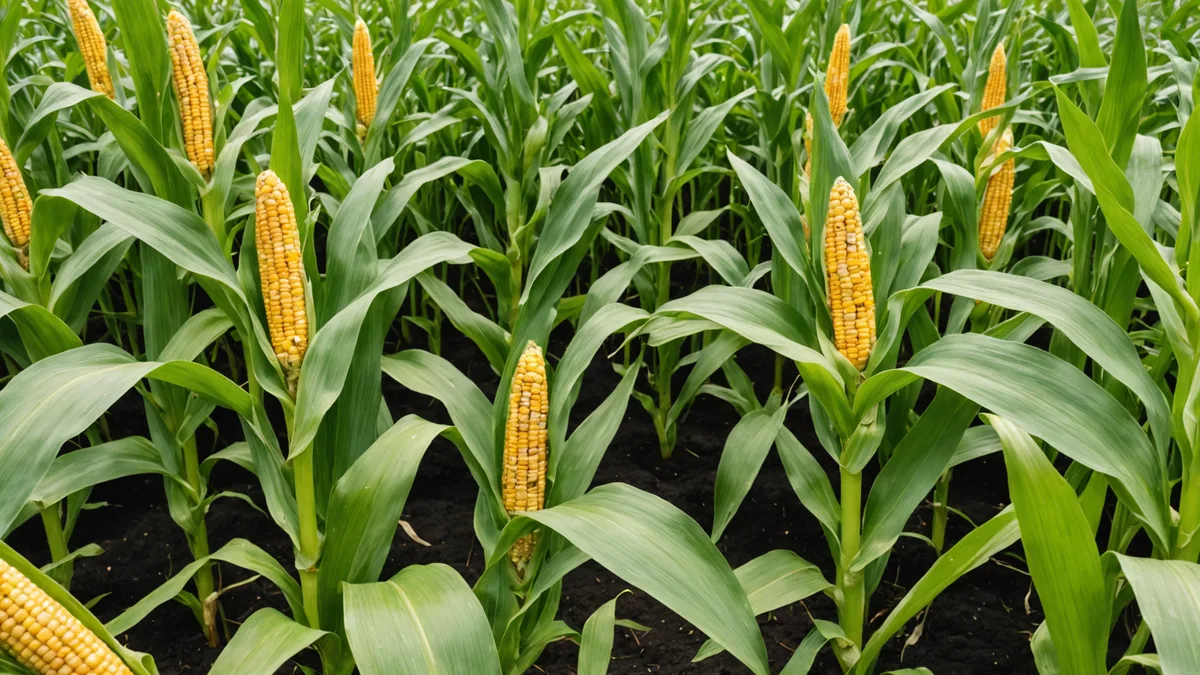
The side-dress nitrogen application window in corn is narrower than most agronomists like to admit. You're looking at V5 to V8, ideally before V6 in most central Iowa conditions, and the decision depends on what's actually happening in the soil at that moment, not what the spring pre-plant plan assumed.
Most growers are still making that call the same way they did 20 years ago: walk a few fields, look at the stand color, check the forecast, and make a judgment. That's not wrong. But satellite NDVI monitoring adds a layer that's hard to replicate by walking.
The pre-V6 nitrogen gap
Before V6, corn is still taking up nitrogen at a relatively modest rate. The big demand curve starts at V6 and peaks around tassel. Pre-plant nitrogen applied in April may have moved below the root zone in a wet spring, or been denitrified in waterlogged soils, and the deficit won't be visible to the eye until the plant is already behind.
The satellite sees field-level variation in NDVI that a walking scout misses. A field that looks uniform when you walk the headlands often has a low-NDVI zone in the northwest corner where soil drainage is slower, or along the old fence line where the soil organic matter drops. Those zones will show up in the satellite data as a subtle NDVI depression, typically 0.05 to 0.12 below the field average, 2 to 4 days before the yellowing is visible from the field road.
What satellite can and can't tell you about nitrogen
Let's be direct about what NDVI can measure: chlorophyll content. What NDVI cannot directly measure: soil nitrate, root uptake rate, or whether the cause of chlorosis is nitrogen versus sulfur versus waterlogging. The satellite gives you the stress signal; the agronomic interpretation still requires boots in the field.
What satellite monitoring changes is the prioritization. Instead of scouting fields in the order you drive to them, you scout the flagged zones first. That alone can cut your diagnostic time significantly when you're managing multiple operations across multiple fields at critical season timing.
Timing the side-dress decision
The practical workflow that Daniel uses with Croploom-monitored operations: check the NDVI trend on flagged fields starting at V4, pull a tissue sample from low-NDVI zones if the flag persists beyond V5, and make the side-dress call based on the sample plus the satellite trend, not the pre-plant plan.
The satellite isn't replacing the agronomic decision. It's tightening the window in which you have the information to make the decision correctly. The difference between side-dressing at V5 on a correct diagnosis versus V7 on a delayed one can be 15 to 25 bushels per acre in a wet spring where pre-plant N has moved.
Multi-field flagging
Where satellite monitoring pays for itself most clearly in the nitrogen context is when you're looking across 20 or 30 fields simultaneously. The system flags the fields where the NDVI trend is breaking downward early and ranks them. You focus attention on those first. The fields that are tracking normally get a lower-priority visit.
That allocation of scouting time is the practical return on the satellite subscription. Not that the satellite replaces your judgment, but that it tells you where to spend the judgment first.
Reading NDVI trend direction, not just value
One of the most commonly misused satellite metrics is the raw NDVI value. Growers and agronomists often look at the map and think "0.72 -- is that good or bad?" In isolation, that number is nearly meaningless. The plant population, hybrid, growth stage, and day-of-year all affect what a normal NDVI value should be in that field at that time.
The metric that actually drives useful nitrogen decisions is the trend: is the NDVI increasing, holding steady, or declining relative to the prior pass? And is the rate of change in this field different from neighboring fields at the same growth stage? A declining trend in week 6 where surrounding fields are still green and increasing is a materially different signal than the same NDVI value in a field that has been declining since week 4 alongside everything else in the county.
Croploom's NDVI trend view shows the rolling 4-pass trajectory for every field zone and compares it to the median trajectory for similar fields in the region at the same crop stage. That regional context is what turns an abstract NDVI number into an actionable early-warning flag: this field is underperforming its neighbors by a widening margin at V5, and that pattern has historically correlated with nitrogen deficiency in wet springs at this soil type in this county.
After the side-dress: closing the feedback loop
One thing most growers do not do after a side-dress application is track whether the NDVI trend actually recovered in the treated zones. If the side-dress was applied and the low-NDVI zone continues to decline for two more passes, the nitrogen deficiency hypothesis may have been wrong, or the application window may have been too late, or there's a secondary problem that the nitrogen application didn't address.
Tracking NDVI response to input applications is how you build a calibrated model for what works in your specific fields over multiple seasons. The growers who get the most return from satellite monitoring over a 3 to 5 year window aren't just using the data for in-season decisions -- they're building a history that makes each subsequent season's decisions faster and more confident. The satellite's memory of the field is longer and more complete than most farm records.