How Croploom Works
Three data sources. One decision-ready report.
Croploom's fusion engine ingests satellite passes, drone flights, and weather risk data to produce a field-by-field stress picture updated every analysis cycle.
Satellite
Sentinel-2 NDVI every 3-5 days
AI Fusion
Multi-source anomaly detection
Stress Alert
Ranked zones with cause hypothesis
Satellite Layer
Sentinel-2 NDVI, calibrated for row crops
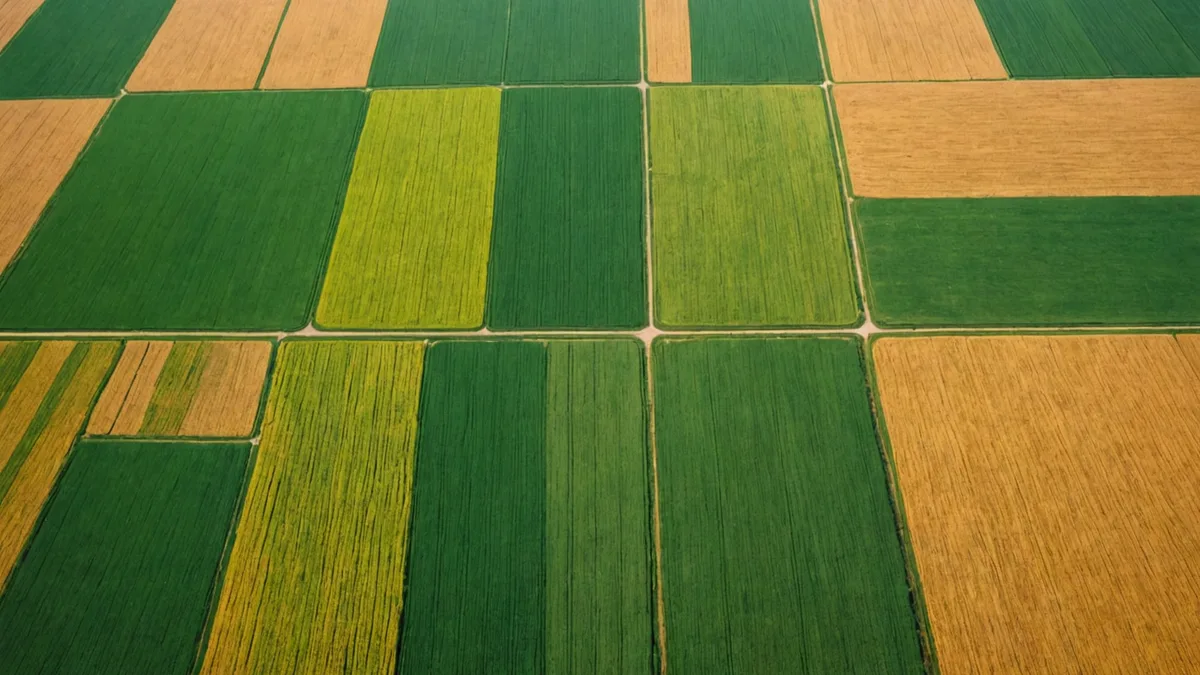
Every 3-5 days, Croploom ingests the latest Sentinel-2 multispectral pass and computes NDVI, NDRE, and thermal anomaly indices specific to corn and soybean growth stages.
Drone Layer
Thermal imagery fills the gaps satellite can't reach
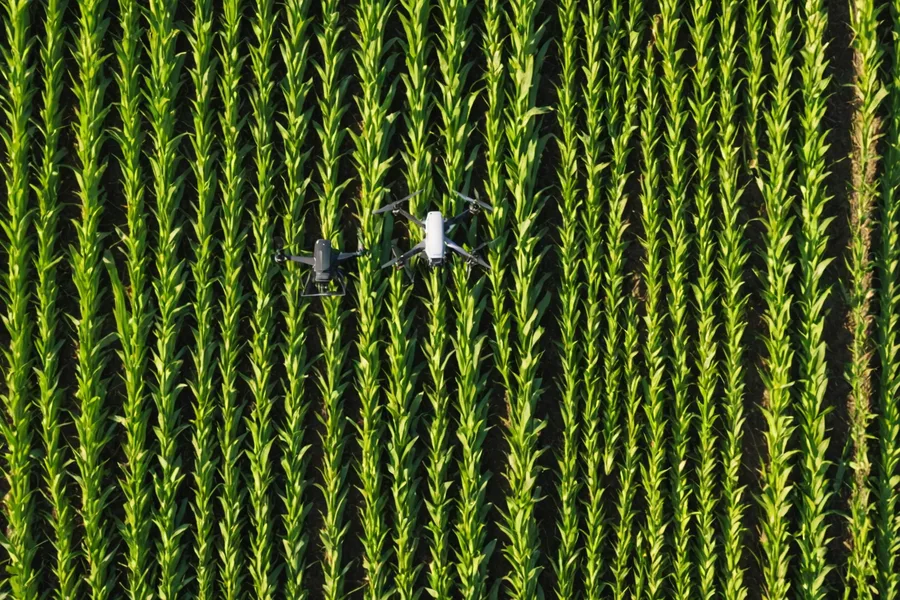
Cloud cover, revisit intervals, and pixel resolution all limit what satellites can detect. Drone thermal flights slot in on-demand to confirm suspected stress zones at sub-meter resolution.
-
Canopy Temperature Mapping
Detect heat stress and water stress before visible chlorosis develops.
-
Soil Moisture Proxies
Bare soil thermal patterns correlate with drainage issues invisible to NDVI.
AI Analysis Engine
From data to decision in under 2 hours
Once new imagery lands, Croploom's model cross-references historical baselines, growth-stage norms, and multi-source signals to classify stress type and urgency.
Stress Classification
The model distinguishes between nitrogen deficiency, compaction, water stress, and pest pressure based on spectral signatures and thermal patterns.
Urgency Scoring
Each zone is scored by estimated yield impact and response window. The top three urgent zones surface to your daily dashboard automatically.
Prescription Output
Variable-rate prescription shapefiles generated from the stress classification, ready for upload to your equipment controller.
Integrations
Works with the tools you already use
Croploom exports to major farm management platforms and prescription systems. No lock-in. Your data stays yours.
John Deere Operations Center
Shapefile export compatible with JD machine sync for variable-rate passes.
Climate FieldView
Layer import via standard GeoTIFF for zone-based management workflows.
API Access
Operation plan subscribers get REST API access to raw zone data and alert feeds.
Start Free
See Croploom on your actual fields
Upload your field boundaries and get a full satellite stress analysis on your current season. No credit card, no commitment.